
Center of Gravity Estimating
Estimating the location of a vessel's Center of Gravity (CG) is a very important step in ensuring the adequacy of a design. Specifically, the location of a ship's Longitudinal Center of Gravity (LCG) in relation to its Longitudinal Center of Buoyancy (LCB) and the Longitudinal Center of Flotation (LCF) of its waterplane, dictates the operating trim of the vessel. And, the height of the Center of Gravity above the keel (KG) or Vertical Center of Gravity (VCG) plays a critical role in a ship's motions in waves as well as its Intact and Damaged Stability.
This page provides some information to assist in estimating the VCG and LCG of a design based on trendlines for similar vessel's and the layout of the design, particularly with respect to the mission payload weights.
In general for estimating CG I have divided a ship's weight data into four main parts, as follows;
- Group 1 - the base vessel, including SWBS 100, 200, 300, the base part of group 400, 500, and 600
- Group 2 - the fixed
mission payload weights, including SWBS 450, 460, 470, 480, 490 , all
of 700, and F20
- Group 3 - the ship's other loads (the remainder of the SWBS F loads)
- Group 4 - the ship's margins and Service Life Allowances (to account for weight and CG growth over a ship's life)
Data from Other Vessels and Designs Studies
For
our purposes, CG trendline data for the Group 1 and 3 items have been
based on data from similar ships and design studies. Unfortunately
actual CG location data on ships is often not as publicly
available as weight data, but some data is available for some design
"approximations" of existing ships as well as from a number of publicly
available design studies. As such, some of the
trendlines developed on this page are really more representative of approximations
that others have made rather than abeing representative of actual
vessels.
Hopefully as I collect and analyse more data I can improve these plots and trendlines. But for now care should be taken when using this data asthe reliance on a large number of design studies in lieu of actual design data may result in;
- some trendlines being more
reflective of the design equations used in developing the design
studies rather than data for real ships
- some data points
may be suspect in that some of these designstudies are very preliminary
in nature and may not have been rigorously checked and verified
- some
of the designs, due to their preliminary nature, may not be fully
'balanced' and 'complete' designs and as such may vary a bit off the
trends that might be seen for actual ships
With regards to the above,
if you look at the plot of VCG for Sea
Water Ballast below you can see where several of the data points fall
directly on (or
very nearly on) the "rule of thumb" that VCG = 0.138 D, which suggests
that the values for these designs may have actually been based just on
a simple equation rather than determining the actual VCGs of specific
tanks in the design. Similarly on some of the other plots,
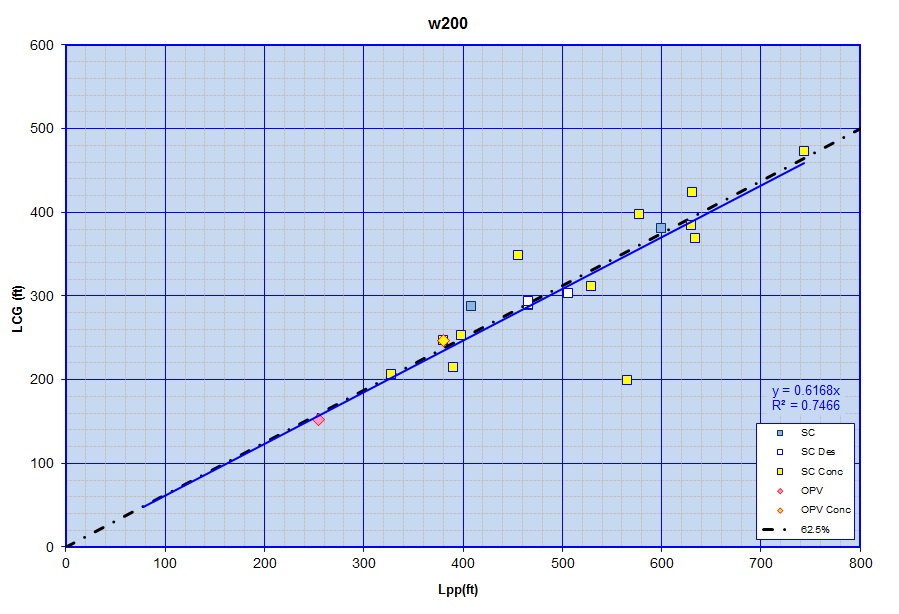
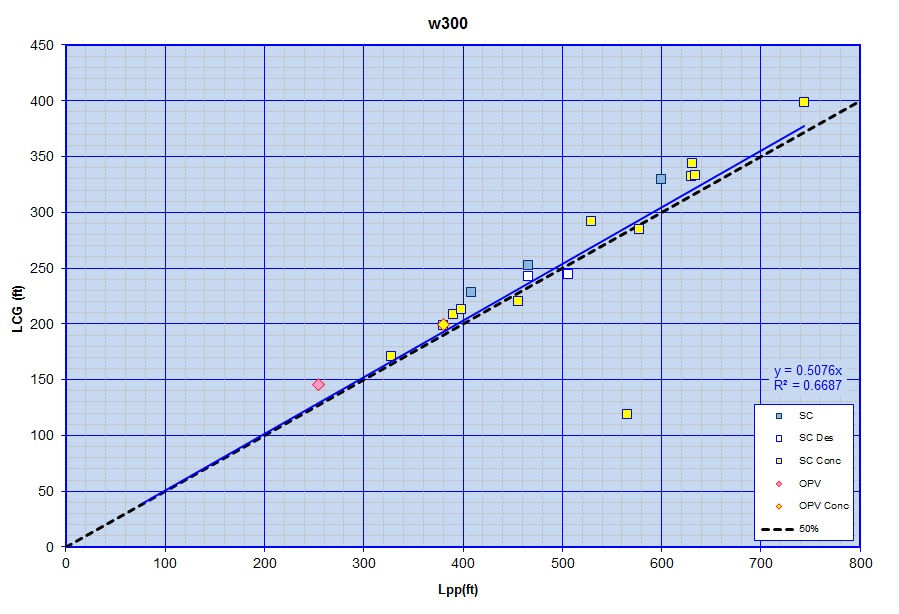
such as the LCG trendlines for SWBS Group 200 and SWBS Group 300,
you can see a point on each plot which falls a significant distance
away from the trendlines for the other points. As such, there is
a suspicion that these specific data points may either be in error or
may perhaps be for designs that may either be out of the norm of
conventional vessels or may not be for fully 'balanced' and 'complete'
designs. In addition, with respect to completeness on at least
one of the design studies that I have looked at in developing these
trendlines I have come across cases where either a complete SWBS group
appeared to be missing or located in a position far out of where they
might be expected to be (such as for one design where the SWBS Group
450 - Radars weight was listed as being 0ft aft of the Forward
Perpendicular and 0 ft above the Keel).
Hopefully
though, if I can get more data I will be able to expand the analyses and
improve the estimates.
Data for Group 2 items has been taken directly from design studies for the specific mission payload components on those designs. From this data I have tried to derive some general rules of thumb or trendlines to help estimate the CG location dat for other similar items.
Data
for Group 4 items has
been taken from general naval architecture design practices as outlined
by Naval Sea Systems Command (NAVSEA) and the Society of Allied Weight
Engineers (SAWE) in their Recommended Practices documentation.
Group 1
VCG Data
SWBS 100 Group
A
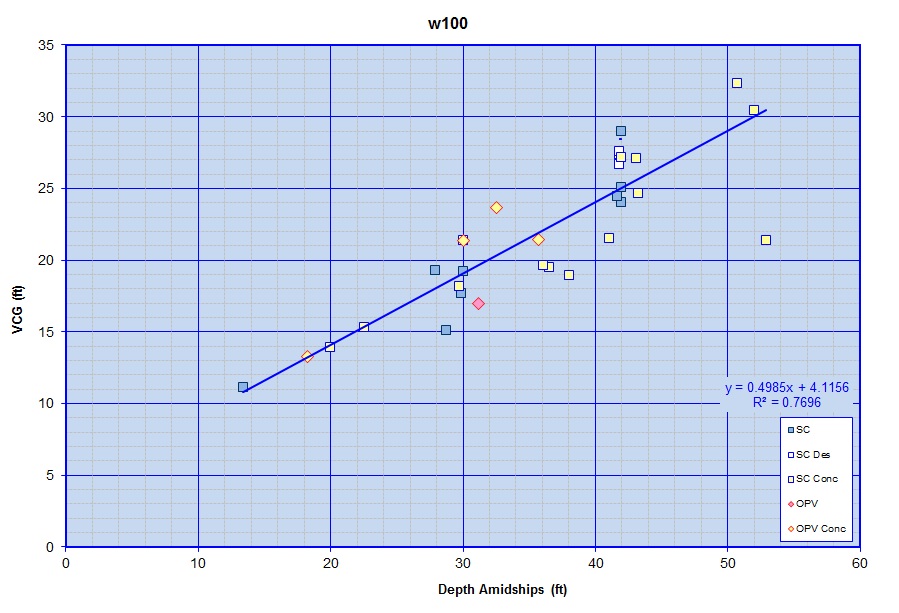
plot of Group 100 VCG vs
Hull Depth is shown below. The data appears to show a somewhat
linear relationship between the two, though the data point at D = ~53
ft and VCG =~21.5ft does seem to fall a bit further off the trendline
than the data for the other ships and designs and as such may possibly
be in error or for a design that is a bit less similar to the more
conventional designs from the rest of the database.
In addition to this plot for the entire w100 group, I have also plotted up the info for the Structural weight broken into four subgroups representing;
- Foundations (SWBS 180)
- Masts (SWBS 170)
- Superstructure (SWBS 150)
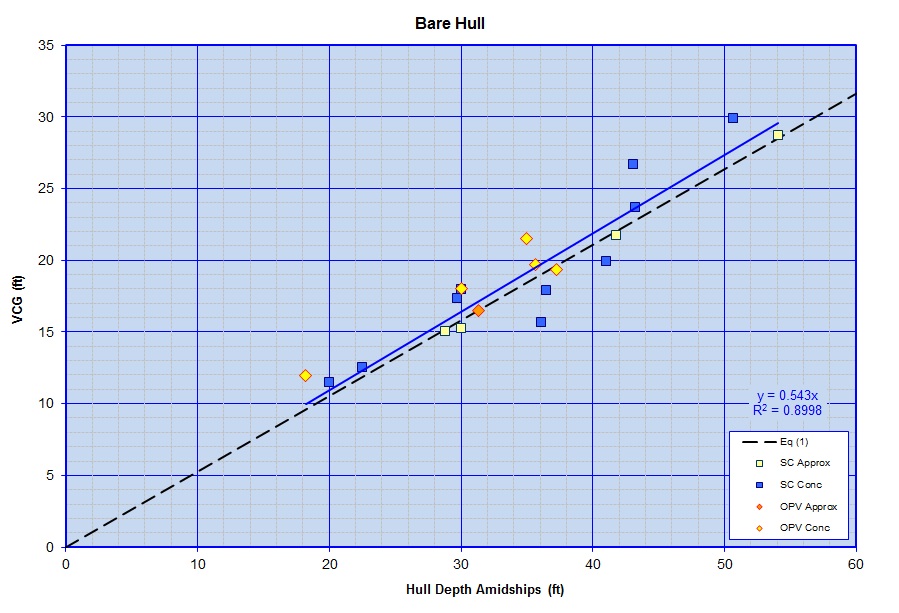
- Bare Hull (SWBS 100 - SWBS 180 - SWBS 170 - SWBS 150)
As shown below the available data for the Bare Hull (SWBS Groups 110 to 140 + 160 & 190) is fairly well represented by a simple linear relationship where VCG = 0.543 D. The Black dashed line represents a rule of thumb where VCG for Group 300 is assumed to be 0.527 D.
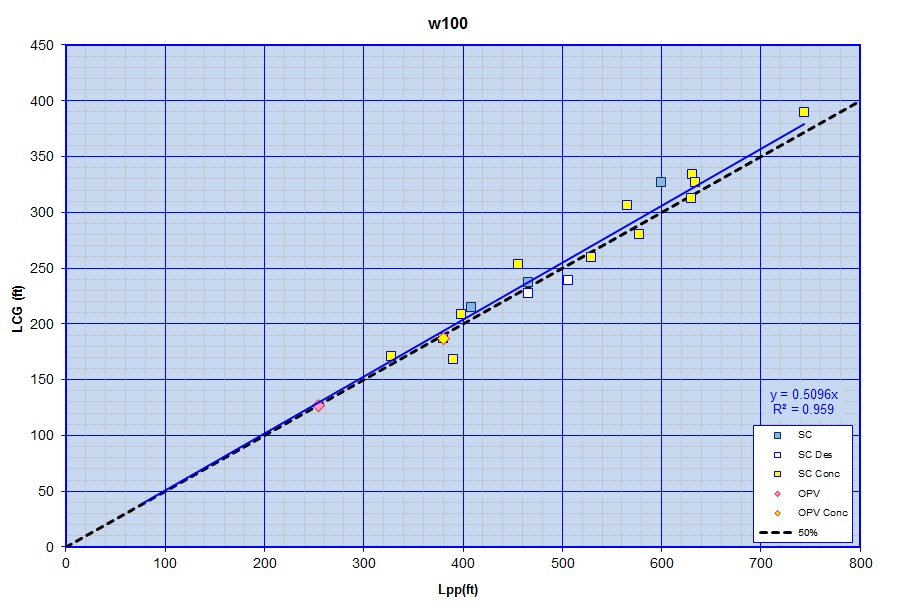
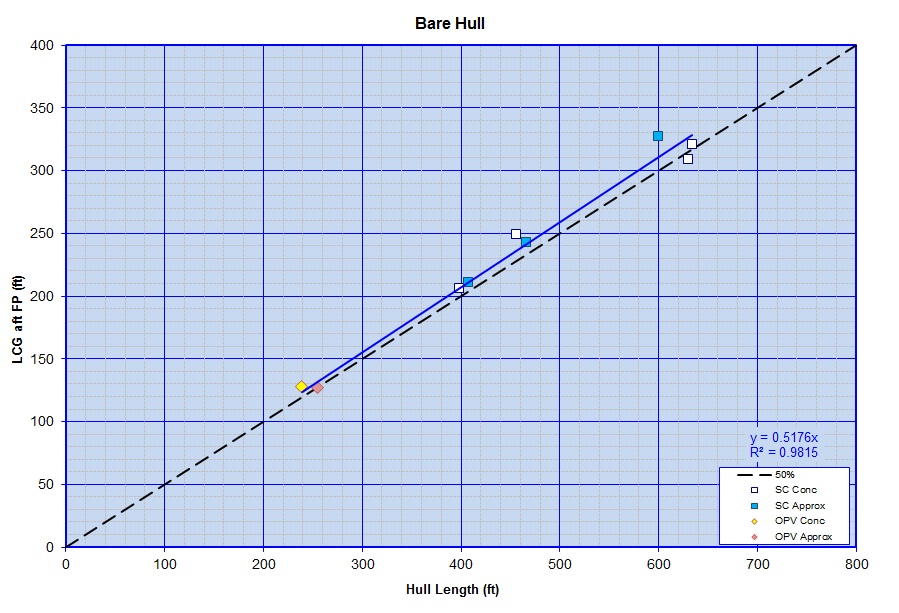
Similarly a plot of LCG for this data is shown below. The information that I have appears to fall very close to the the Black dashed line representing a length 50% LBP aft of the FP, though the actual trendling through the data points is actually closer to 51.8% LBP aft of the FP. Probabaly either estimate could be used to estimate the LCG of the bare hull Group 100 weight.
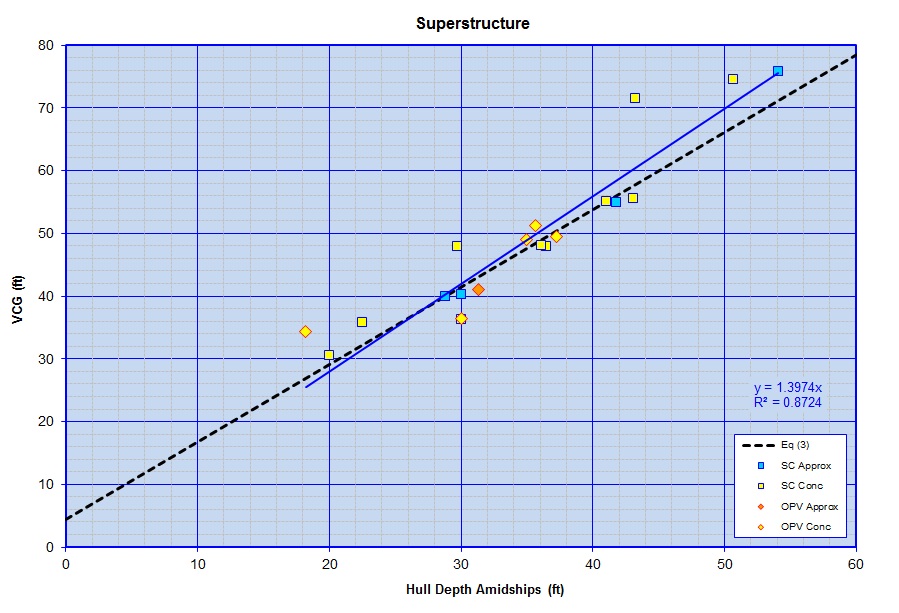
As shown below the available data for the Superstructure (SWBS Group 150) is also fairly well represented by a simple linear relationship where VCG = 1.397 D. The Black dashed line represents a rule of thumb where VCG for Group 300 is assumed to be VCG = 1.233 D + 4.44.
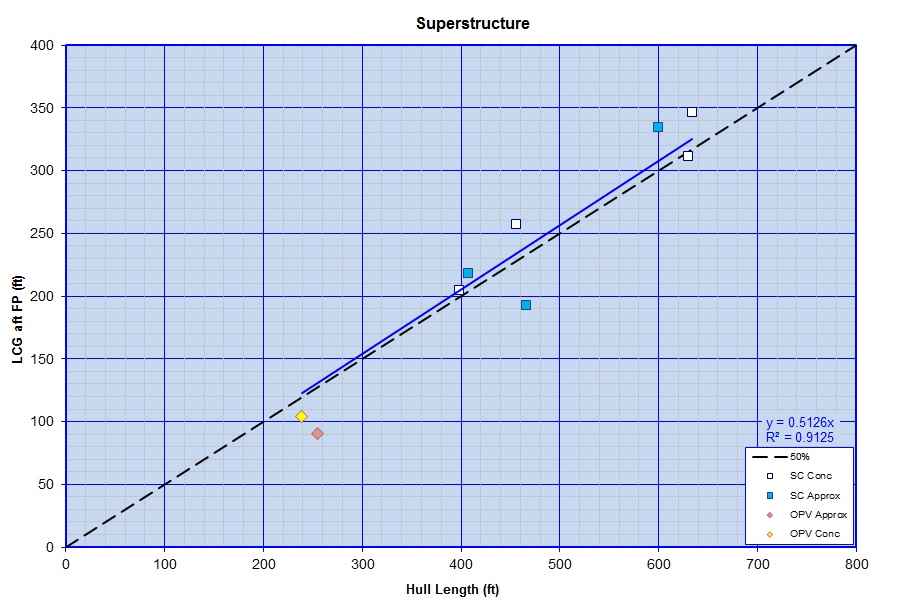
As in the plot below the LCG for the Superstructure for the data points available fall close to about 51.3% LPP aft the FP, though eventually I hope to maybe try and develop a method to relate the VCG and LCG more closely to the actual size and location of the Superstructure on a given design.
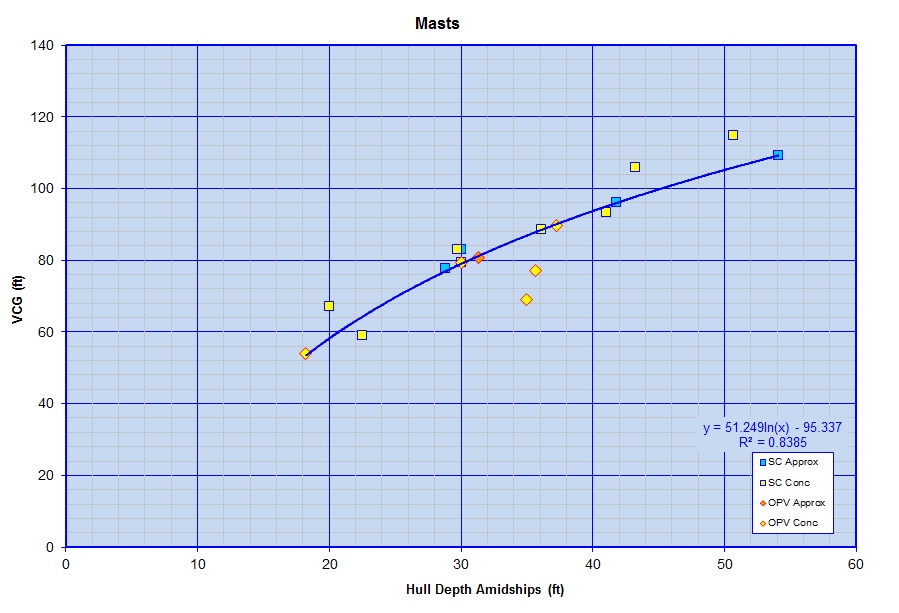
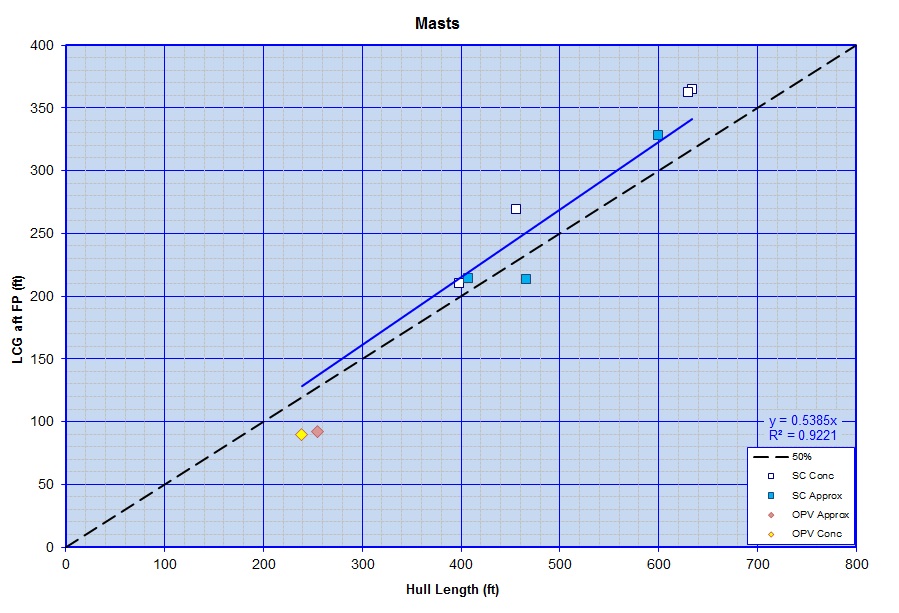
As shown below the available VCG data for the Masts (SWBS Group 170) is kind of close to linear at its upper end, but tapers down at the lower end. As such, the best curve fit appears to be a natural logarithmic function. Also, in putting together this plot I dropped the data points for two design studies out of the analysis because the Weight and VCG listed for the Masts appeared to not be very well in line with the actual profiles of those vessels. As such, since these were two data points were for design studies rather than actual real world vessels it may be that the original designers had not accurately "input" the correct VCG's for the masts on those designs in their simulations (demonstrating another potential downside of having to rely too much on design studies rather than data on actual designs). For the LCG of the masts, the currently available data appears to be close to about 53.9% LPP aft the FP, though I eventually hope to relate the LCG for these items to the profile drawing of the design.
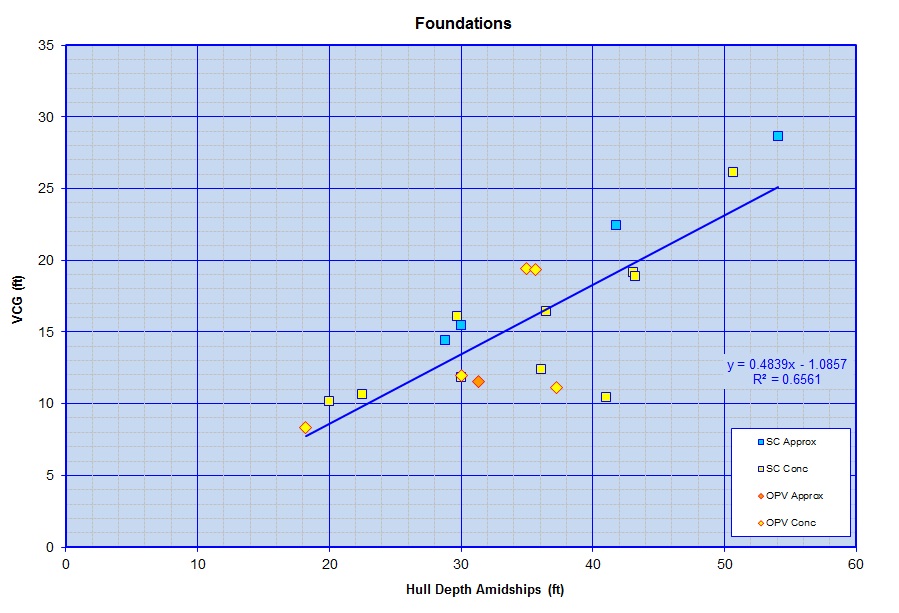
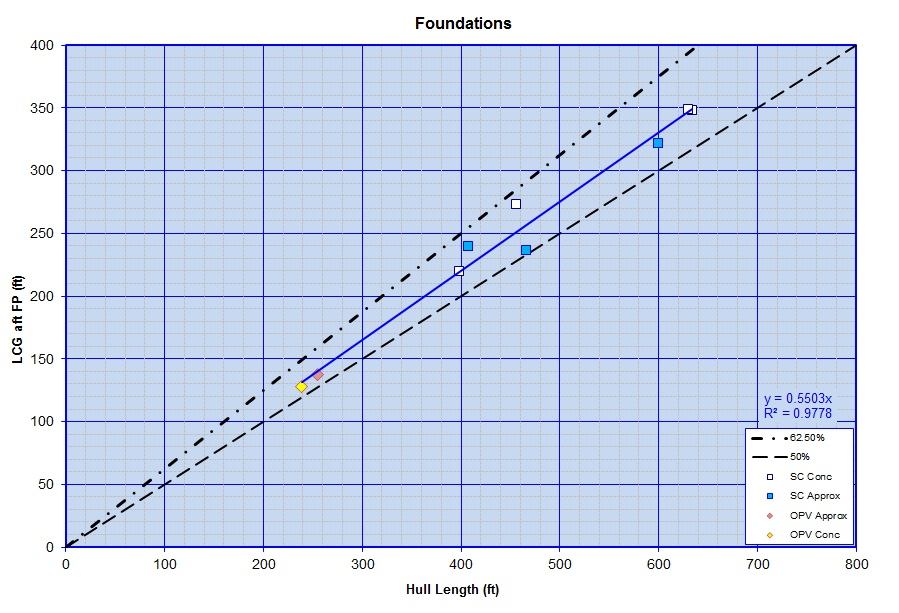
The plots shown below provides information for the VCG and LCG of the Foundations (SWBS Group 180) for the vessels, approximations and design studies in my database. The LCG data also shows a close relationship to being about 55.0% LPP aft the FP.
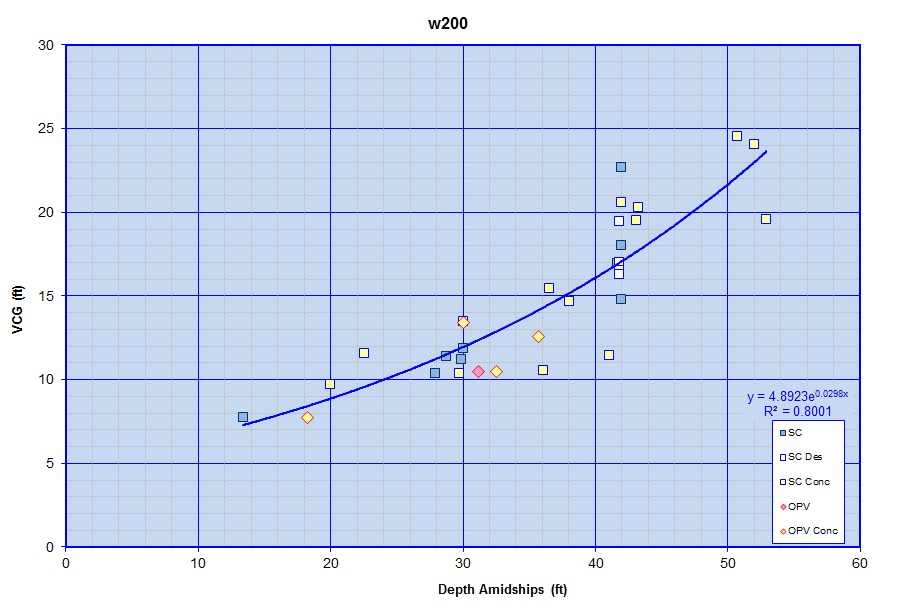
SWBS 200 Group
A plot of Group 200 VCG vs
Depth Amidships is shown below. In general the data appeared to
be best fit by an Exponential relationship.
SWBS 300 Group
A plot of Group 300 VCG vs Depth Amidships is shown below. In general the data has a bit of scatter to it though it appears to show a fairly linear relationship between the two. I hope to take a closer look at the three Surface Combatant Design Studies and the single OPV Concept point that fall furthest below the trendline curve to try and see if there are any reasons why they might fall further below the curve than the other data points do. The Black dashed line represents a rule of thumb where VCG for Group 300 is assumed to be 0.7 D.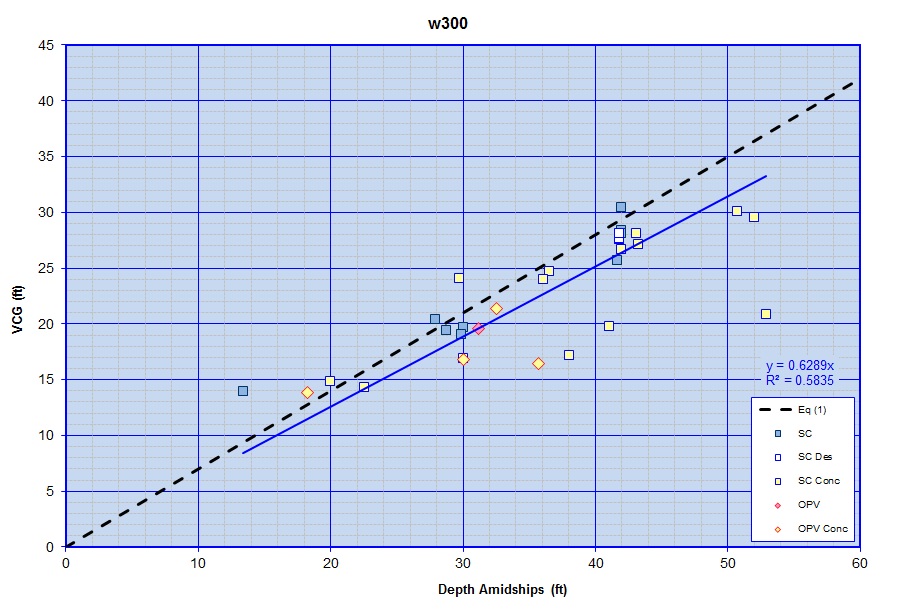
SWBS 410 to 440 Group
A plot of VCG for Group 410-440 vs Depth Amidship is shown below. There is a fair bit more scatter here than for the other weight groups but for now a linear relationship appeared to give the best fit.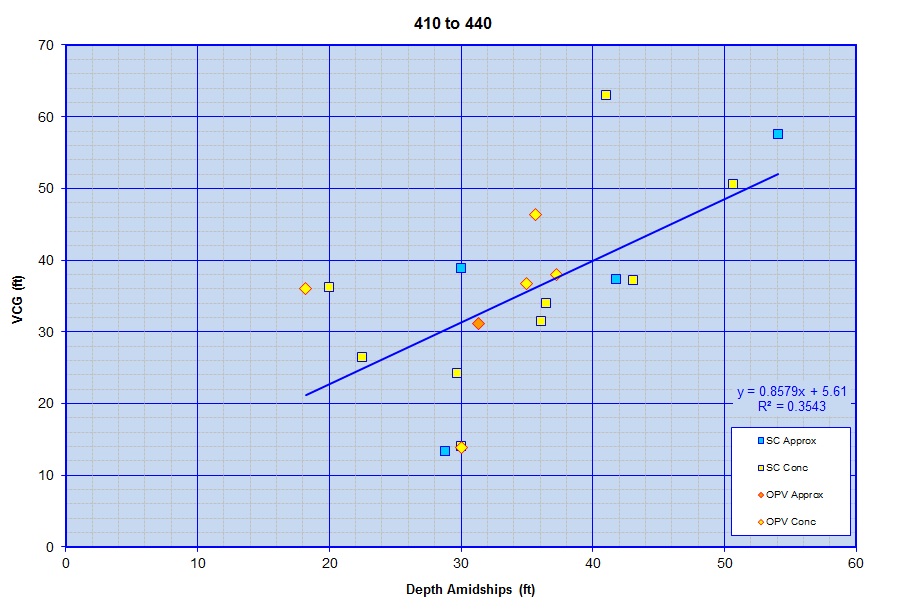
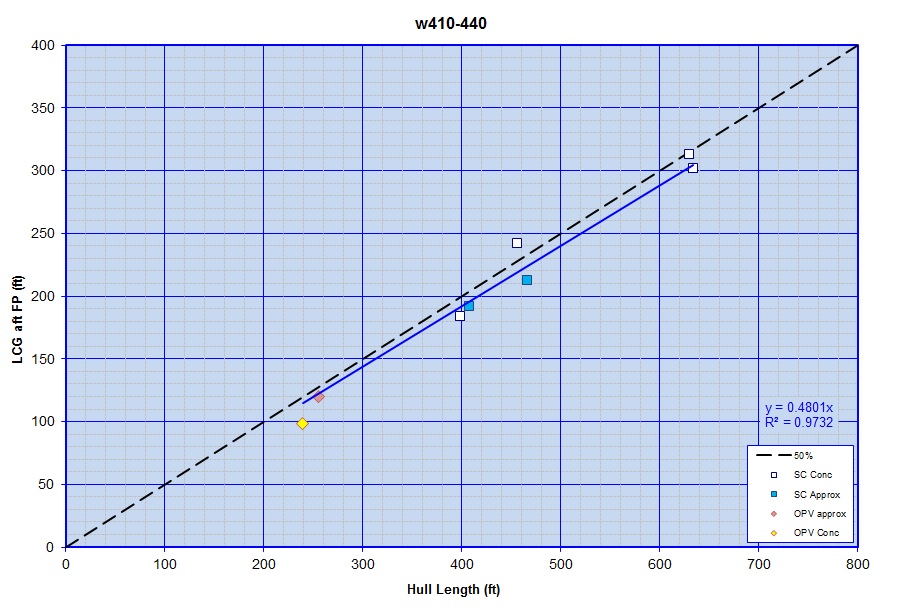
A plot of LCG for Group 410-440 vs LPP is shown below. Although I don't have data for a large number of data points, the data available appears to show a trendline ~48.0 % LPP aft the FP.
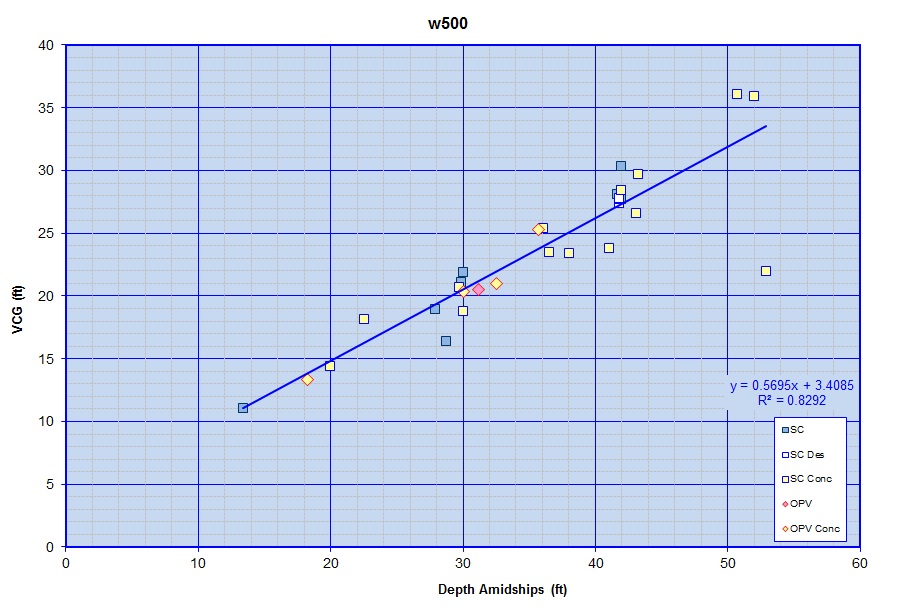
SWBS 500 Group
A plot of Group 500 vs
Depth Amidship is shown below. Here a linear relationship
appeared to give a reasonable fit, though the one data point at D = ~53ft and VCG = ~ 22ft may possibly be an outlier.
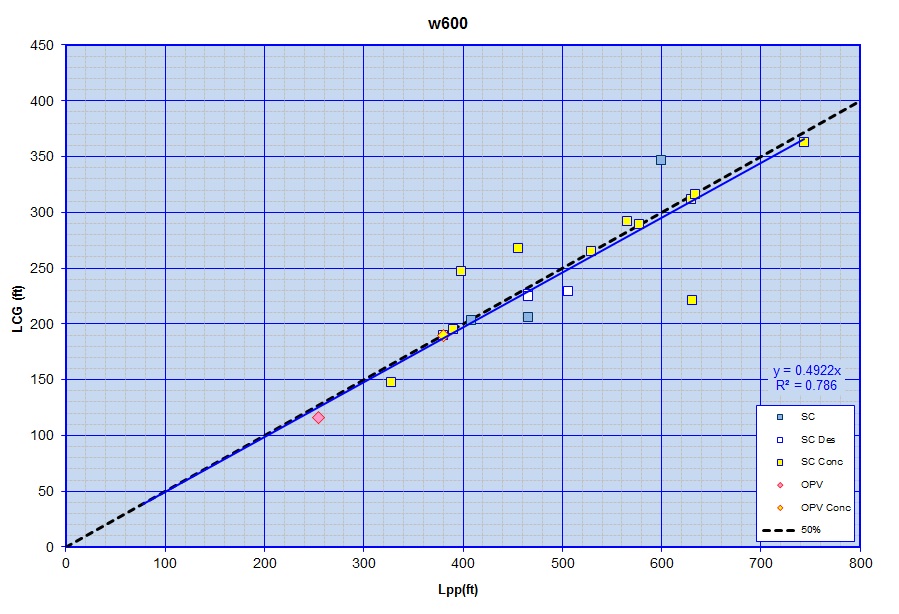
SWBS 600 Group
A plot of Group 600 VCG vs Depth Amidship is shown below and appears to show a roughly linear relationship, though the data point at D = ~38ft and VCG =~ 9ft appears that it might be in error (and if it were for instance a typographical/conversion error where the VCG is actually in meters rather than feet the data would potentially fall closer to the trendline for the rest of the data..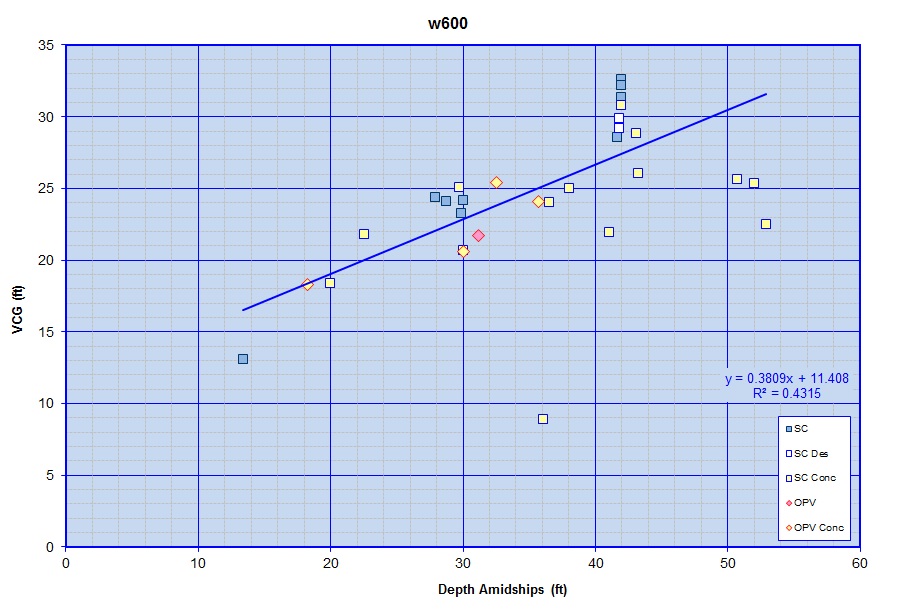
Group 2 VCG Data
Determining CG data for specific mission items has been based on reviewing a number of design studies to determine where the CG has been assumed in those design studies in comparison to the notional location of that item onboard the ship.
Below is a list of Mission
Payload type items collected from these design studies noting the
VCG location in relation to the deck that the item is mounted on.
Under Development
SWBS 700 & F20 Items
| Mission Payload Item |
Ht of Weapom (above Deck) |
Ht of Munitions (above Deck) |
||
| (ft) | (m) | (ft) | (m) | |
| SWBS 711 & F21 - Guns | ||||
| Mk 15 or 16 CIWS | +2.7 | +0.82 | +1.7 | +1.7 |
| Ex-35 25mm Sea Vulcan Mount w/Stinger |
+3.5 | +1.07 | +3.5 | +1.7 |
| 30mm CIGS Mount |
TBD | TBD | TBD | +1.7 |
| 40mm CIWS/Multi-Purpose Gun |
+3.0 | +0.91 | -7.0 | +1.7 |
| Mk3 57mm Gun |
+2.0 | +0.61 | +2.0 (for rds in mount) -4.0 (for rds in mag) |
+1.7 |
| Mk75 76mm Gun | -3.2 | -0.98 | -6.2 | -1.89 |
| Mk42 57mm Gun | +5.0 | +1.52 | -15.3 | -4.66 |
| Mk45 57mm Gun | -6.2 to -8.0 |
-1.89 to -2.44 |
-22.4 to -24.2 |
-6.83 to -7.38 |
| 155mm AGS | -1.7 | +0.61 | -23.0 | -7.01 |
| SWBS 721 & F21 - Missile Systems |
||||
| 8-cell RAM Launcher |
TBD | TBD | TBD | TBD |
| 21-cell RAM Launcher |
TBD | TBD | TBD | TBD |
| Quad Harpoon Missile Launcher |
+2.7 | +0.82 | +14.0 | +4.27 |
| Mk 13 Missile Launcher |
-6.2 | -1.89 | -4.0 | -1.22 |
| Mk 16 ASROC Launcher |
+7.5 | +2.29 | +5.0 (for rds in launcher) |
+1.52 |
| Mk 29 NATO Sea Sparrow Launcher |
+2.3 | +0.70 | +4.3 (for rds in launcher) +1.3 (for reloads) |
+1.31 +0.40 |
| Mk 41 VLS Missile Launcher |
||||
| Self Defense | -8.0 | -2.44 | -5.4 | -1.65 |
| Tactical | -11.8 | -3.60 | ~-9.2 | ~-2.80 |
| Strike | -13.7 | -4.18 | -11.1 | -3.38 |
| SWBS 750 & F21- Torpedo Systems | ||||
| 12.75" Triple Torpedo Tubes |
+1.15 (empty) +2.25 (loaded) |
+0.35 (empty) +0.69 (loaded) |
||
| SWBS 760 & F21- Small Arms and Pyro Systems | ||||
| Small Arms and Pyro Systems | ~+3.5 | ~+1.07 | ~-6.3 | ~-1.92 |
| SWBS F23
& F26 - Helo & Helo Munitions |
||||
| Helo & Helo Munitions | +4.6 | +1.40 | ~+4.6 | ~+1.40 |
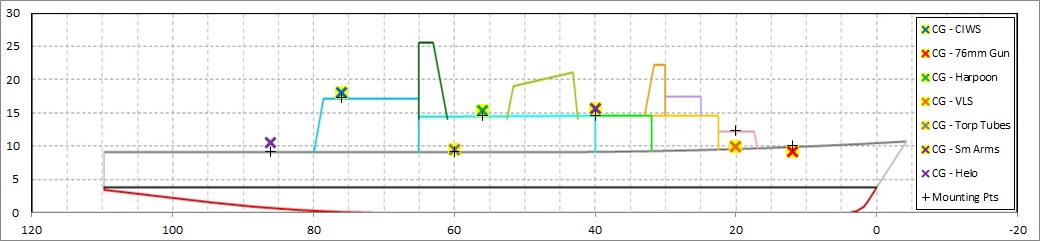
For LCG the location is
assumed to be basically the center of the item as shown on a profile of
the design. The figure below shows a notional design identifying
the LCG and VCG locations of the Mission Payload items onboard, for
reference. The Black "+" symbols represent the actual mounting points of the equipment, while the colored "X" symbols represent the location of the CG for these items.
Group 3 VCG Data
SWBS F10 (Crew) Items
A plot of Group F10 - Crew Weights VCG vs Hull Depth is shown below. The data appears to show a fairly linear relationship between the two. The Black dashed line represents a rule of thumb where VCG for Group F10 is assumed to be 0.708 D +1.41. The Black dashed-dot line represents a rule of thumb where VCG for Group F10 is assumed to be 0.732 D.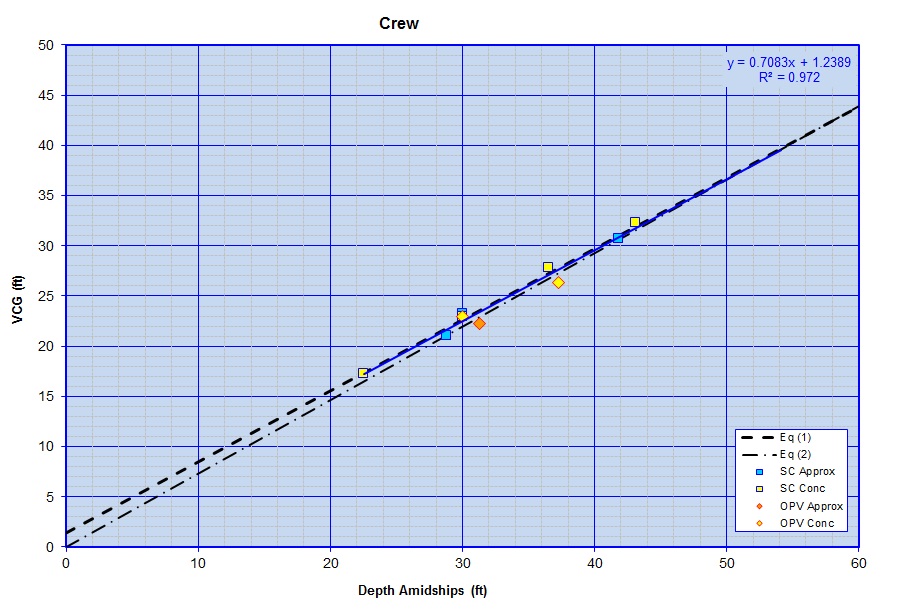
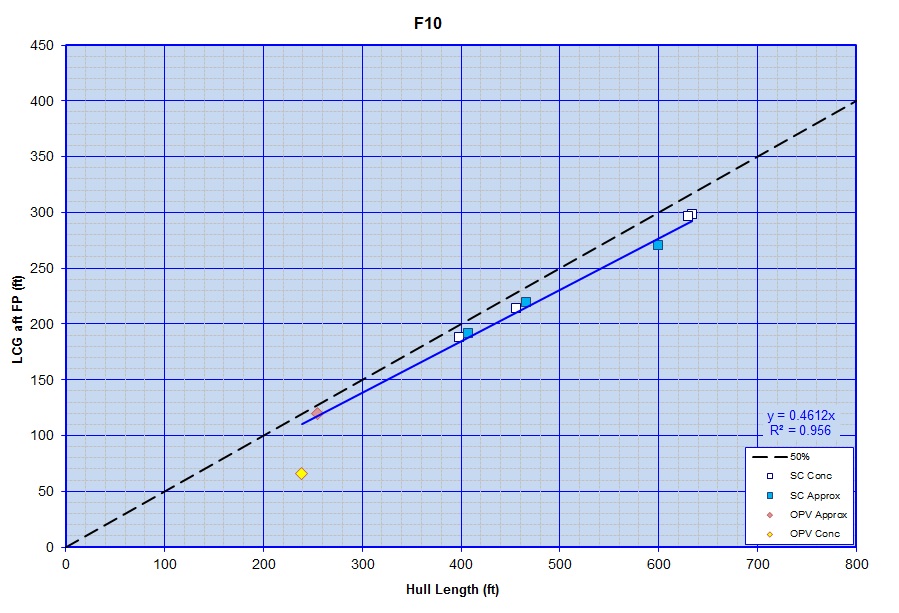
With regards to the plot of LCG for SWBS Group F10 vs LPP the data appears to fall close to alinear relationship. The Black dashed line representing a distance 50% LPP aft the FP.
SWBS F30 (Stores) Items
A plot of Group F30 - Stores VCG vs Hull Depth is shown below. The data appears to show a fairly linear relationship between the two.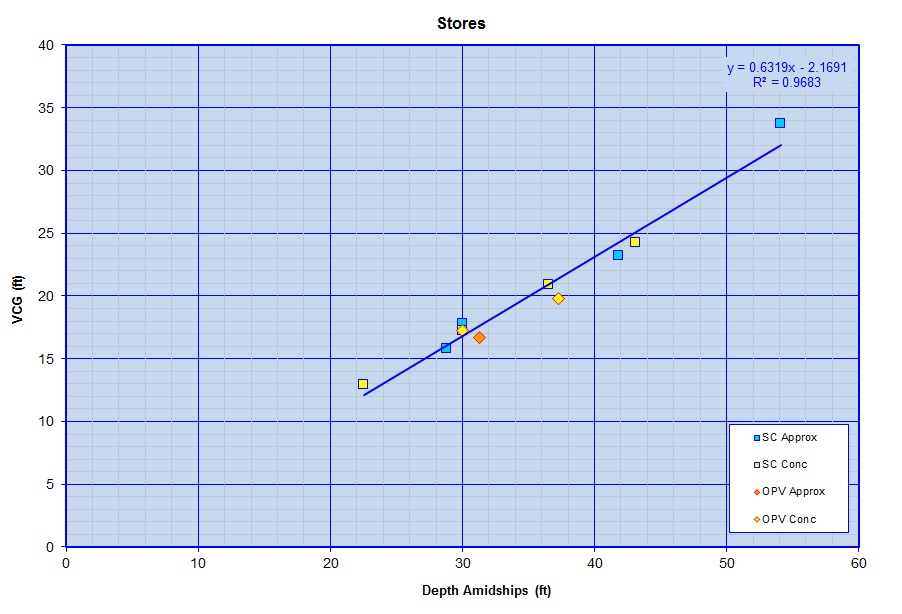
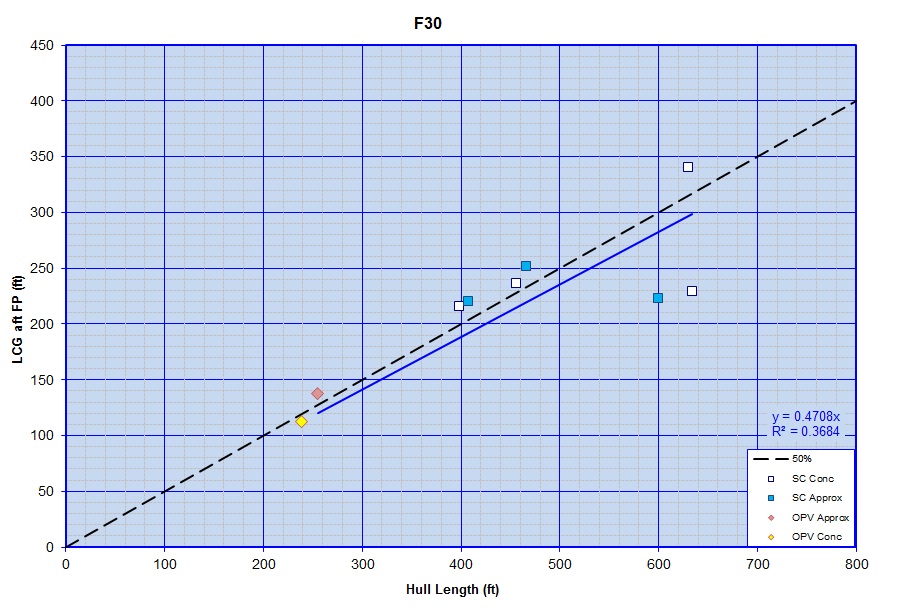
With regards to the plot of LCG for SWBS Group F30 vs LPP two data points appear to fall a bit below the others, and I hope to take a closer look at these points later to see if there is anything about the designs that may indicate why they differ from the other designs. The Black dashed line representing a distance 50% LPP aft the FP.
SWBS F40 (Petroleum Based Liquids) Items
A plot of Group F41 - Diesel Fuel Marine (DFM) VCG vs Hull Depth is shown below. Unfortunately there appears to be a fair bit of scatter in the data, and I hope to do some further analysis and potentially add some sdditional data point to further refine this analysis. The Black dashed-dot line represents a rule of thumb where VCG for Group F10 is assumed to be 0.1375 D +3.0.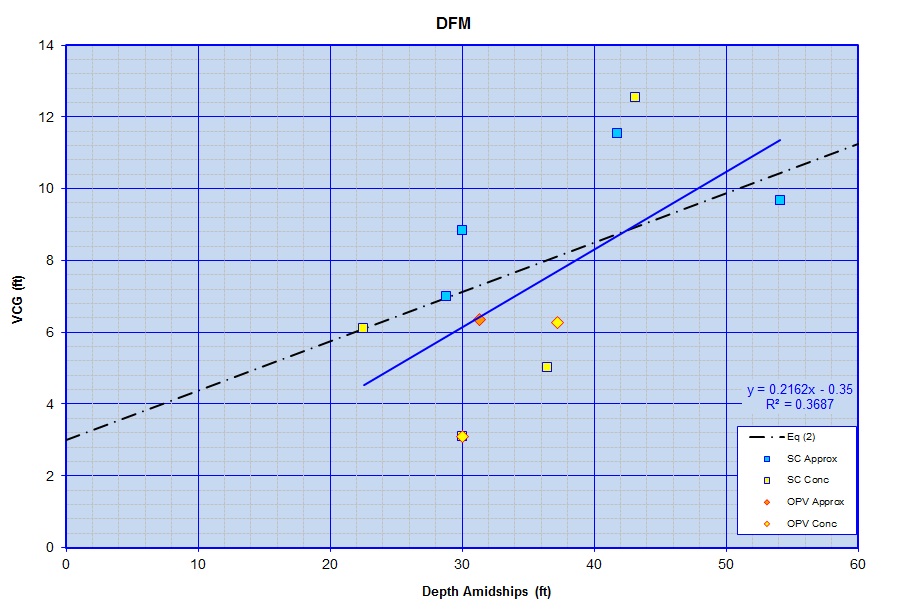
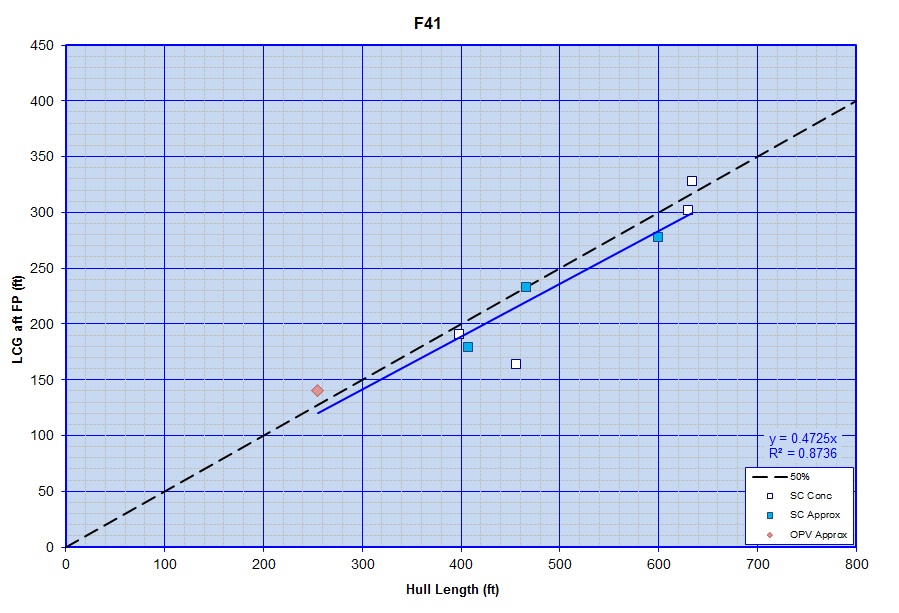
A plot of LCG for the SWBS F41 vs LPP is shown below and indicates a linear relationship. The Black dashed line representing a distance 50% LPP aft the FP.
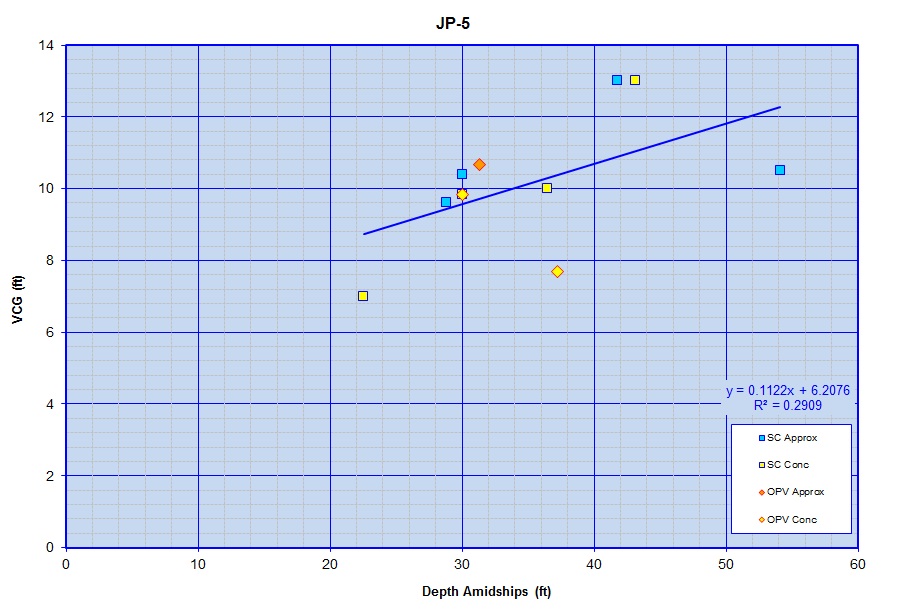
A plot of Group F42 - JP-5 (Aviation Fuel) VCG vs Hull Depth is shown below. Unfortunately there appears to be a fair bit of scatter in this data as well, and I hope to do some further analysis and potentially add some sdditional data point to further refine this analysis. For now a linear fit has been applied to the data, though a constant value of ~9ft above the Keel may be suitable, until more data can be collected.
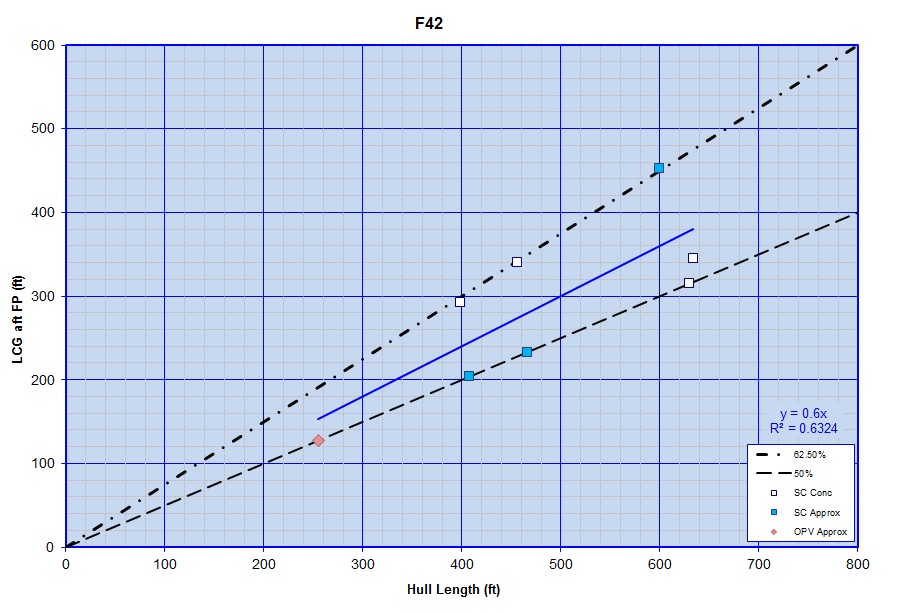
The plot of Group F42 - JP-5 (Aviation Fuel) LCG vs LPP shows the data falling into two basic groups. Many of the points appear to fall on, or near to the Black dashed line, and as such these points may reflect that a "default" 50% LPP value was used for these designs for this SWBS group. The other points appear to fall near a value of ~75% LPP. Unfortunately, I'm not sure which trendline would be the better one to use at this time.
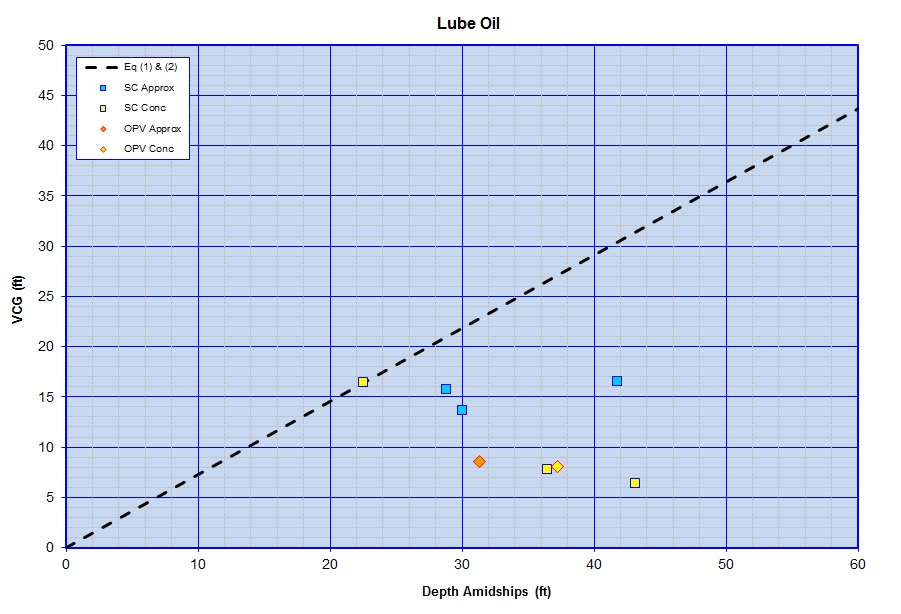
A plot of Group F46 - Lube Oil VCG vs Hull Depth is shown below. Unfortunately there appears to be no real discernable trend in this data, though a rule of thumb, as shown by the Black dashed line, is available where VCG for this group is assumed to be equal to 0.728 D. For the data available all the data points appear to be on or beneath that suggested estimate.
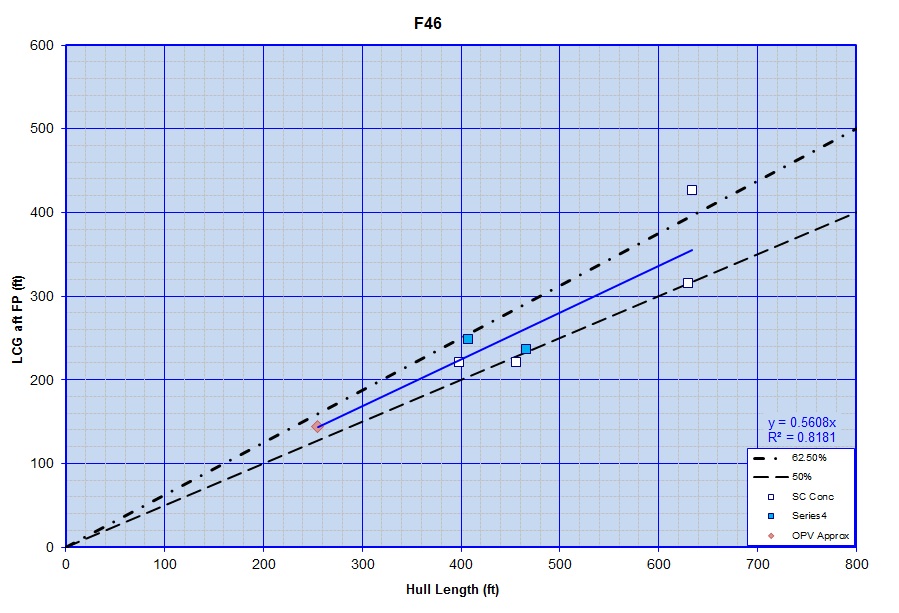
A plot of Group F46 - Lube Oil LCG vs LPP is shown below, and although there is some scatter, it appears that a trendline of ~ 56.1% of the LPP aft the FP, may be acceptable.
SWBS F50 (Non-Petroleum Based Liquids) Items
A plot of Group F51 - Sea Water VCG vs Hull Depth is shown below. Since Sea Water is typically often used as ballast, not all ships or designs will necessarily have Sea Water listed in their weight reports. As such, only a few data points were available in my database for this SWBS Group, and although I've fit a Power Function through the data for now, enough data probably isn't really available to come up with a good estimate here yet. Similarly I don't currently have LCG data for Group 51 dat, so I would suggest just using a value of 50% LPP aft of the FP for now.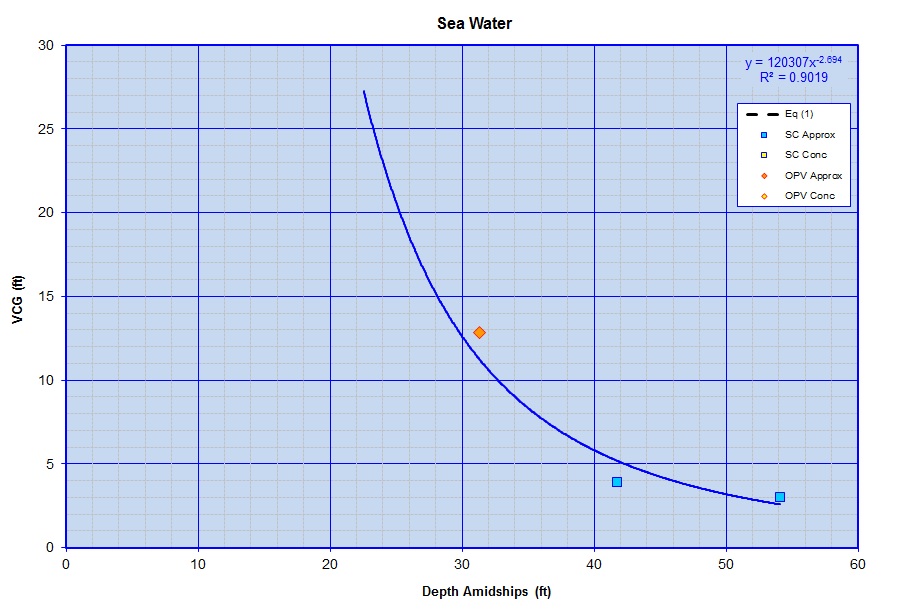
A plot of Group F52 - Fresh Water VCG vs Hull Depth is shown below. Interestingly the data appears to fall into two general groups. Some data points appear to fall on or very near a rule of thumb curve, as shown by the Black dashed-dot line, where VCG is assumed to be equal to 0.138 D. However many of the other data points fall well above this Rule of Thumb. It is possible that this may represent the difference between ships where fresh water is stored in Deep Tanks vs those where fresh water may be stored in tanks just above the ship's double bottom tanks (ie, on the innerbottom plating). I hope to try and look more closely at this data later to see if I can develop some better estimates.
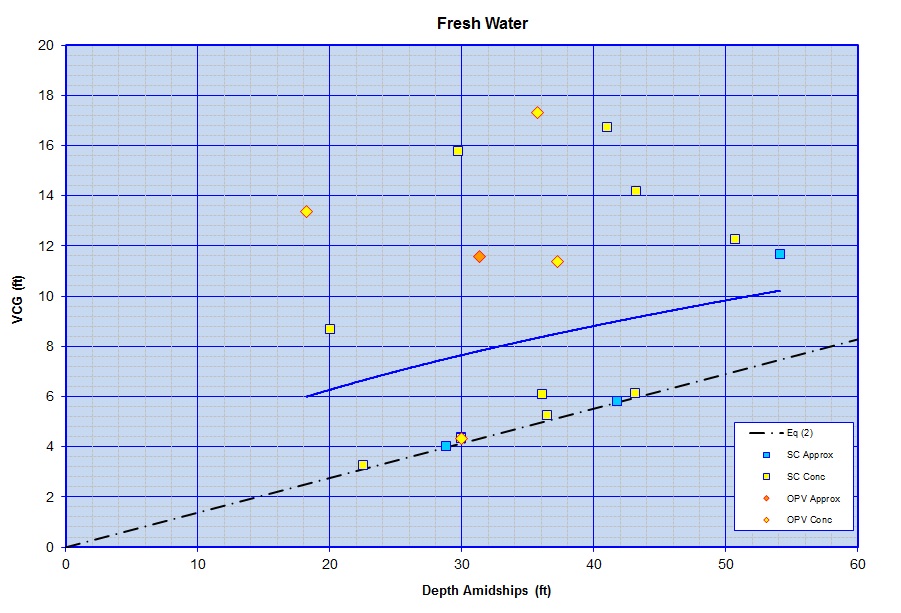
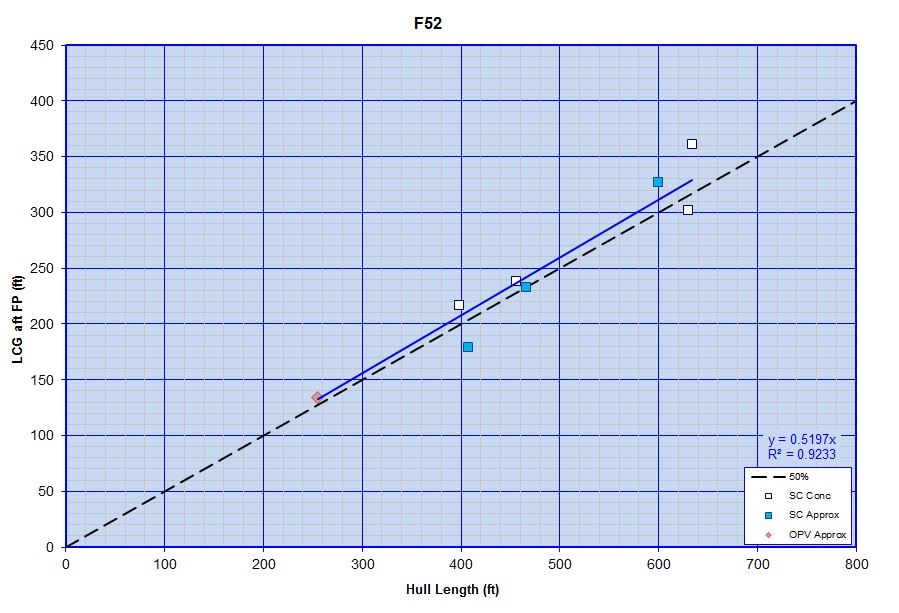
From the plot of Group F52 - Fresh Water LCG vs LPP shown below a trendline where LCG =~ 52.0% LPP aft the FP appears to be a reasonable fit.