Cost Estimating
The cost estimating methodology used in this spreadsheet are based primarily on three MIT theses entitled;
And Total Undiscounted Life Cycle Cost is equal to the sum of the above where Disposal/Residual Cost may either be positive or negative depending on whether there is a cost associated with disposing the vessel or whether the sale of the vessel at the end of its service life may net a positive return.
Further information on the methodology used to calculate Life Cycle Costs in this spreadsheet can be found at the following link.
This data is also plotted below.

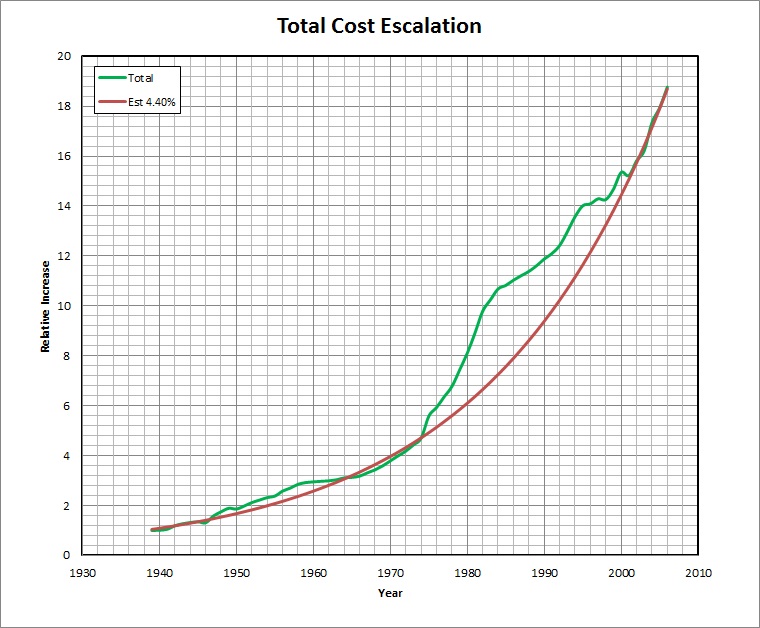
From a review of this data it appears that by assuming roughly a 4.40% escalation factor provides a fair representation of the total cost increases, and has been used for dates beyond the year 2006.

- "An Approach for Developing a Preliminary Cost Estimating Methodology for USCG Vessels", by Mark James Gray dated 1987
- "Estimation of ship Construction Costs", by Aristides Miroyannis dated 2006
- "Updating MIT's Cost Estimation Model for Shipbuilding", by LTJG Matthew B. Smith (USCG) dated 2008
- Acquisition Costs
- Life Cycle Costs
Acquisition Costs
In the methods described in these theses, used in this spreadsheet, Acquisition Costs can be further broken into the following segments;- Shipbuilder Costs
- Total Construction Costs
- Profit
- Change Orders
- Government Costs
- Support Costs
- Project Management (PM) Growth
- Government Furnished Equipment (GFE) [including Small Boats, Internal Communications, Ordnance, Electronics]
- Outfitting Costs
- Post Delivery (PSA) Costs
- Total Shipbuilder Costs + Total Government Costs is also sometimes referred to as Total End Cost
- Total End Cost + PSA Costs is also sometimes referred to as Total Ship Acquisition Cost
Further information on the methodology used to calculate Acquisition Costs in this spreadsheet can be found at the following link.
Life Cycle Costs
Life Cycle Costs can be broken into several subgroups as follows;- Total Ship Research and Development Cost
- Ship Design and Development Cost
- Ship Test and Evaluation Cost
- Payload Test and Evaluation Cost
- Total Investment Cost
- Ship Prime Equipment Cost
- Payload Prime Equipment Cost
- Ship Shore Based Support Equipment Costs
- Payload Shore Based Equipment Costs
- Ship Spares and Repair Equipment Costs (shore Supply)
- Payload Spares and Repair Parts Costs (Sh
- Total Costs of Personnel
- Costs of Pay and Allowances
- Costs of Temporary Assigned Duty (TAD)
- Total Operating and Support Costs
- Cost of Operations
- Total Maintenance Cost
- Total Fuel Cost
- Replenishment Spares Cost
- Cost of Major Support
- Disposal/Residual Cost
( Ship Prime Equipment Cost + Payload Prime Equipment Cost ) / Total Number of Ships in Service
And Total Undiscounted Life Cycle Cost is equal to the sum of the above where Disposal/Residual Cost may either be positive or negative depending on whether there is a cost associated with disposing the vessel or whether the sale of the vessel at the end of its service life may net a positive return.
Further information on the methodology used to calculate Life Cycle Costs in this spreadsheet can be found at the following link.
Cost Escalation
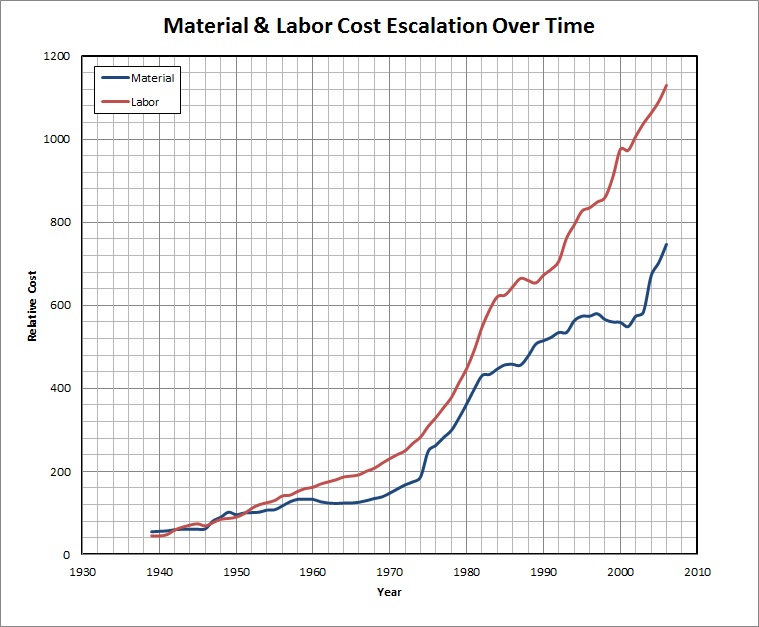
With respect tot he costs calulated in the spreadsheet, much of the calculations have been based on information from 1981 and an attempt has been made to allow this data to be 'escalated' or 'de-escalated' to other dates based on the following information, which I believe comes from the US Bureau of Labor Statistics (need to check this).| Year | Material | Labor | Total | Material as a % of Total | Increase Over Time | Assumed 4.40% Increase |
|---|---|---|---|---|---|---|
| 1939 | 55 | 45 | 100 | 55% | 1.00 | 1.04 |
| 1940 | 56 | 45 | 101 | 55% | 1.01 | 1.09 |
| 1941 | 57 | 48 | 105 | 54% | 1.05 | 1.14 |
| 1942 | 60 | 59 | 119 | 50% | 1.19 | 1.19 |
| 1943 | 61 | 66 | 127 | 48% | 1.27 | 1.24 |
| 1944 | 61 | 71 | 132 | 46% | 1.32 | 1.29 |
| 1945 | 61 | 74 | 135 | 45% | 1.35 | 1.35 |
| 1946 | 62 | 69 | 131 | 47% | 1.31 | 1.41 |
| 1947 | 81 | 77 | 158 | 51% | 1.58 | 1.47 |
| 1948 | 90 | 85 | 175 | 51% | 1.75 | 1.54 |
| 1949 | 102 | 87 | 189 | 54% | 1.89 | 1.61 |
| 1950 | 96 | 90 | 186 | 52% | 1.86 | 1.68 |
| 1951 | 100 | 98 | 198 | 51% | 1.98 | 1.75 |
| 1952 | 101 | 111 | 212 | 48% | 2.12 | 1.83 |
| 1953 | 102 | 120 | 222 | 46% | 2.22 | 1.91 |
| 1954 | 107 | 125 | 232 | 46% | 2.32 | 1.99 |
| 1955 | 108 | 130 | 238 | 45% | 2.38 | 2.08 |
| 1956 | 117 | 141 | 258 | 45% | 2.58 | 2.17 |
| 1957 | 127 | 143 | 270 | 47% | 2.70 | 2.27 |
| 1958 | 133 | 152 | 285 | 47% | 2.85 | 2.37 |
| 1959 | 133 | 159 | 292 | 46% | 2.92 | 2.47 |
| 1960 | 133 | 162 | 295 | 45% | 2.95 | 2.58 |
| 1961 | 127 | 170 | 297 | 43% | 2.97 | 2.69 |
| 1962 | 124 | 175 | 299 | 41% | 2.99 | 2.81 |
| 1963 | 123 | 180 | 303 | 41% | 3.03 | 2.93 |
| 1964 | 124 | 187 | 311 | 40% | 3.11 | 3.06 |
| 1965 | 124 | 189 | 313 | 40% | 3.13 | 3.20 |
| 1966 | 126 | 192 | 318 | 40% | 3.18 | 3.34 |
| 1967 | 130 | 201 | 331 | 39% | 3.31 | 3.49 |
| 1968 | 135 | 208 | 343 | 39% | 3.43 | 3.64 |
| 1969 | 139 | 220 | 359 | 39% | 3.59 | 3.80 |
| 1970 | 148 | 231 | 379 | 39% | 3.79 | 3.97 |
| 1971 | 158 | 241 | 399 | 40% | 3.99 | 4.14 |
| 1972 | 168 | 250 | 418 | 40% | 4.18 | 4.32 |
| 1973 | 175 | 268 | 443 | 40% | 4.43 | 4.51 |
| 1974 | 187 | 283 | 470 | 40% | 4.70 | 4.71 |
| 1975 | 249 | 309 | 558 | 45% | 5.58 | 4.92 |
| 1976 | 263 | 330 | 593 | 44% | 5.93 | 5.14 |
| 1977 | 282 | 354 | 636 | 44% | 6.36 | 5.36 |
| 1978 | 299 | 378 | 677 | 44% | 6.77 | 5.60 |
| 1979 | 329 | 414 | 743 | 44% | 7.43 | 5.84 |
| 1980 | 363 | 448 | 811 | 45% | 8.11 | 6.10 |
| 1981 | 399 | 493 | 892 | 45% | 8.92 | 6.37 |
| 1982 | 431 | 548 | 979 | 44% | 9.79 | 6.65 |
| 1983 | 434 | 590 | 1024 | 42% | 10.24 | 6.94 |
| 1984 | 447 | 621 | 1068 | 42% | 10.68 | 7.25 |
| 1985 | 457 | 625 | 1082 | 42% | 10.82 | 7.57 |
| 1986 | 458 | 645 | 1103 | 42% | 11.03 | 7.90 |
| 1987 | 456 | 665 | 1121 | 41% | 11.21 | 8.25 |
| 1988 | 478 | 660 | 1138 | 42% | 11.38 | 8.61 |
| 1989 | 507 | 654 | 1161 | 44% | 11.61 | 8.99 |
| 1990 | 515 | 673 | 1188 | 43% | 11.88 | 9.38 |
| 1991 | 523 | 687 | 1210 | 43% | 12.10 | 9.80 |
| 1992 | 535 | 707 | 1242 | 43% | 12.42 | 10.23 |
| 1993 | 535 | 762 | 1297 | 41% | 12.97 | 10.68 |
| 1994 | 563 | 794 | 1357 | 41% | 13.57 | 11.15 |
| 1995 | 574 | 827 | 1401 | 41% | 14.01 | 11.64 |
| 1996 | 574 | 835 | 1409 | 41% | 14.09 | 12.15 |
| 1997 | 580 | 849 | 1429 | 41% | 14.29 | 12.69 |
| 1998 | 566 | 860 | 1426 | 40% | 14.26 | 13.24 |
| 1999 | 560 | 908 | 1468 | 38% | 14.68 | 13.83 |
| 2000 | 559 | 976 | 1535 | 36% | 15.35 | 14.44 |
| 2001 | 549 | 973 | 1522 | 36% | 15.22 | 15.07 |
| 2002 | 574 | 1007 | 1581 | 36% | 15.81 | 15.73 |
| 2003 | 584 | 1038 | 1622 | 36% | 16.22 | 16.43 |
| 2004 | 671 | 1063 | 1734 | 39% | 17.34 | 17.15 |
| 2005 | 703 | 1091 | 1794 | 39% | 17.94 | 17.90 |
| 2006 | 747 | 1130 | 1877 | 40% | 18.77 | 18.69 |
This data is also plotted below.

From a review of this data it appears that by assuming roughly a 4.40% escalation factor provides a fair representation of the total cost increases, and has been used for dates beyond the year 2006.

This document maintained by PFJN@mnvdet.com.

